R for Data Cleaning

Published

2025-01-24

Questions

Objectives

  • “How can R help make my research more reproducible?”
  • “How can data tidying facilitate answering analysis questions?”
  • “How can I summarize my data in R?”
  • “To become familiar with the functions of dplyr and the tidyverse suite of packages.”
  • “To use dplyr and the tidyverse packages to prepare data for analysis.”
  • “To be able to create summary tables to answer analysis questions.”

Getting Started

The tidyverse is a collection of packages that facilitates data analysis in R. After installing the tidyverse with install.packages("tidyverse") (see the intro session), you can load it with:

library(tidyverse)
── Attaching core tidyverse packages ──────────────────────── tidyverse 2.0.0 ──
✔ dplyr     1.1.4     ✔ readr     2.1.5
✔ forcats   1.0.0     ✔ stringr   1.5.1
✔ ggplot2   3.5.1     ✔ tibble    3.2.1
✔ lubridate 1.9.4     ✔ tidyr     1.3.1
✔ purrr     1.0.2     
── Conflicts ────────────────────────────────────────── tidyverse_conflicts() ──
✖ dplyr::filter() masks stats::filter()
✖ dplyr::lag()    masks stats::lag()
ℹ Use the conflicted package (<http://conflicted.r-lib.org/>) to force all conflicts to become errors
Tip

Upon loading, the tidyverse prints a message like the one above. Notice that multiple packages (the constituent elements of the “collection”) are actually loaded. For instance, dplyr and tidyr help with data wrangling and transformation, while ggplot2 allows us to draw plots, as you saw in the last session. Often, one just loads the tidyverse and ignores these details, as the individual packages are compatible with each other.

Throughout this module, we will use tidyverse functions to load, wrangle, and visualize real data.

Loading data

As with the intro session, we’ll be using the palmer penguins dataset. First, let’s load the package, then save the raw data to an object using the assignment operator <-. Finally, inspect the raw data that is included using glimpse().

library(palmerpenguins)
penguins_raw <- penguins_raw
glimpse(penguins_raw)
Rows: 344
Columns: 17
$ studyName             <chr> "PAL0708", "PAL0708", "PAL0708", "PAL0708", "PAL…
$ `Sample Number`       <dbl> 1, 2, 3, 4, 5, 6, 7, 8, 9, 10, 11, 12, 13, 14, 1…
$ Species               <chr> "Adelie Penguin (Pygoscelis adeliae)", "Adelie P…
$ Region                <chr> "Anvers", "Anvers", "Anvers", "Anvers", "Anvers"…
$ Island                <chr> "Torgersen", "Torgersen", "Torgersen", "Torgerse…
$ Stage                 <chr> "Adult, 1 Egg Stage", "Adult, 1 Egg Stage", "Adu…
$ `Individual ID`       <chr> "N1A1", "N1A2", "N2A1", "N2A2", "N3A1", "N3A2", …
$ `Clutch Completion`   <chr> "Yes", "Yes", "Yes", "Yes", "Yes", "Yes", "No", …
$ `Date Egg`            <date> 2007-11-11, 2007-11-11, 2007-11-16, 2007-11-16,…
$ `Culmen Length (mm)`  <dbl> 39.1, 39.5, 40.3, NA, 36.7, 39.3, 38.9, 39.2, 34…
$ `Culmen Depth (mm)`   <dbl> 18.7, 17.4, 18.0, NA, 19.3, 20.6, 17.8, 19.6, 18…
$ `Flipper Length (mm)` <dbl> 181, 186, 195, NA, 193, 190, 181, 195, 193, 190,…
$ `Body Mass (g)`       <dbl> 3750, 3800, 3250, NA, 3450, 3650, 3625, 4675, 34…
$ Sex                   <chr> "MALE", "FEMALE", "FEMALE", NA, "FEMALE", "MALE"…
$ `Delta 15 N (o/oo)`   <dbl> NA, 8.94956, 8.36821, NA, 8.76651, 8.66496, 9.18…
$ `Delta 13 C (o/oo)`   <dbl> NA, -24.69454, -25.33302, NA, -25.32426, -25.298…
$ Comments              <chr> "Not enough blood for isotopes.", NA, NA, "Adult…
We can inspect our data by using the interface above. An alternative is to run the command View(penguins_raw) or click on the object in RStudio’s environment panel (in the top-right section).

Let’s review the dataset’s columns:

  • studyName: Sampling expedition from which data were collected, generated, etc.
  • Sample Number: an integer denoting the continuous numbering sequence for each sample
  • Species: a character string denoting the penguin species
  • Region: a character string denoting the region of Palmer LTER sampling grid
  • Island: a character string denoting the island near Palmer Station where samples were collected
  • Stage: a character string denoting reproductive stage at sampling
  • Individual ID: a character string denoting the unique ID for each individual in dataset
  • Clutch Completion: a character string denoting if the study nest observed with a full clutch, i.e., 2 eggs
  • Date Egg: a date denoting the date study nest observed with 1 egg (sampled)
  • Culmen Length: a number denoting the length of the dorsal ridge of a bird’s bill (millimeters)
  • Culmen Depth: a number denoting the depth of the dorsal ridge of a bird’s bill (millimeters)
  • Flipper Length: an integer denoting the length penguin flipper (millimeters)
  • Body Mass: an integer denoting the penguin body mass (grams)
  • Sex: a character string denoting the sex of an animal
  • Delta 15 N: a number denoting the measure of the ratio of stable isotopes 15N:14N
  • Delta 13 C: a number denoting the measure of the ratio of stable isotopes 13C:12C
  • Comments: a character string with text providing additional relevant information for data

You can read more about these variables by querying ?penguins_raw and reading the Help documentation.

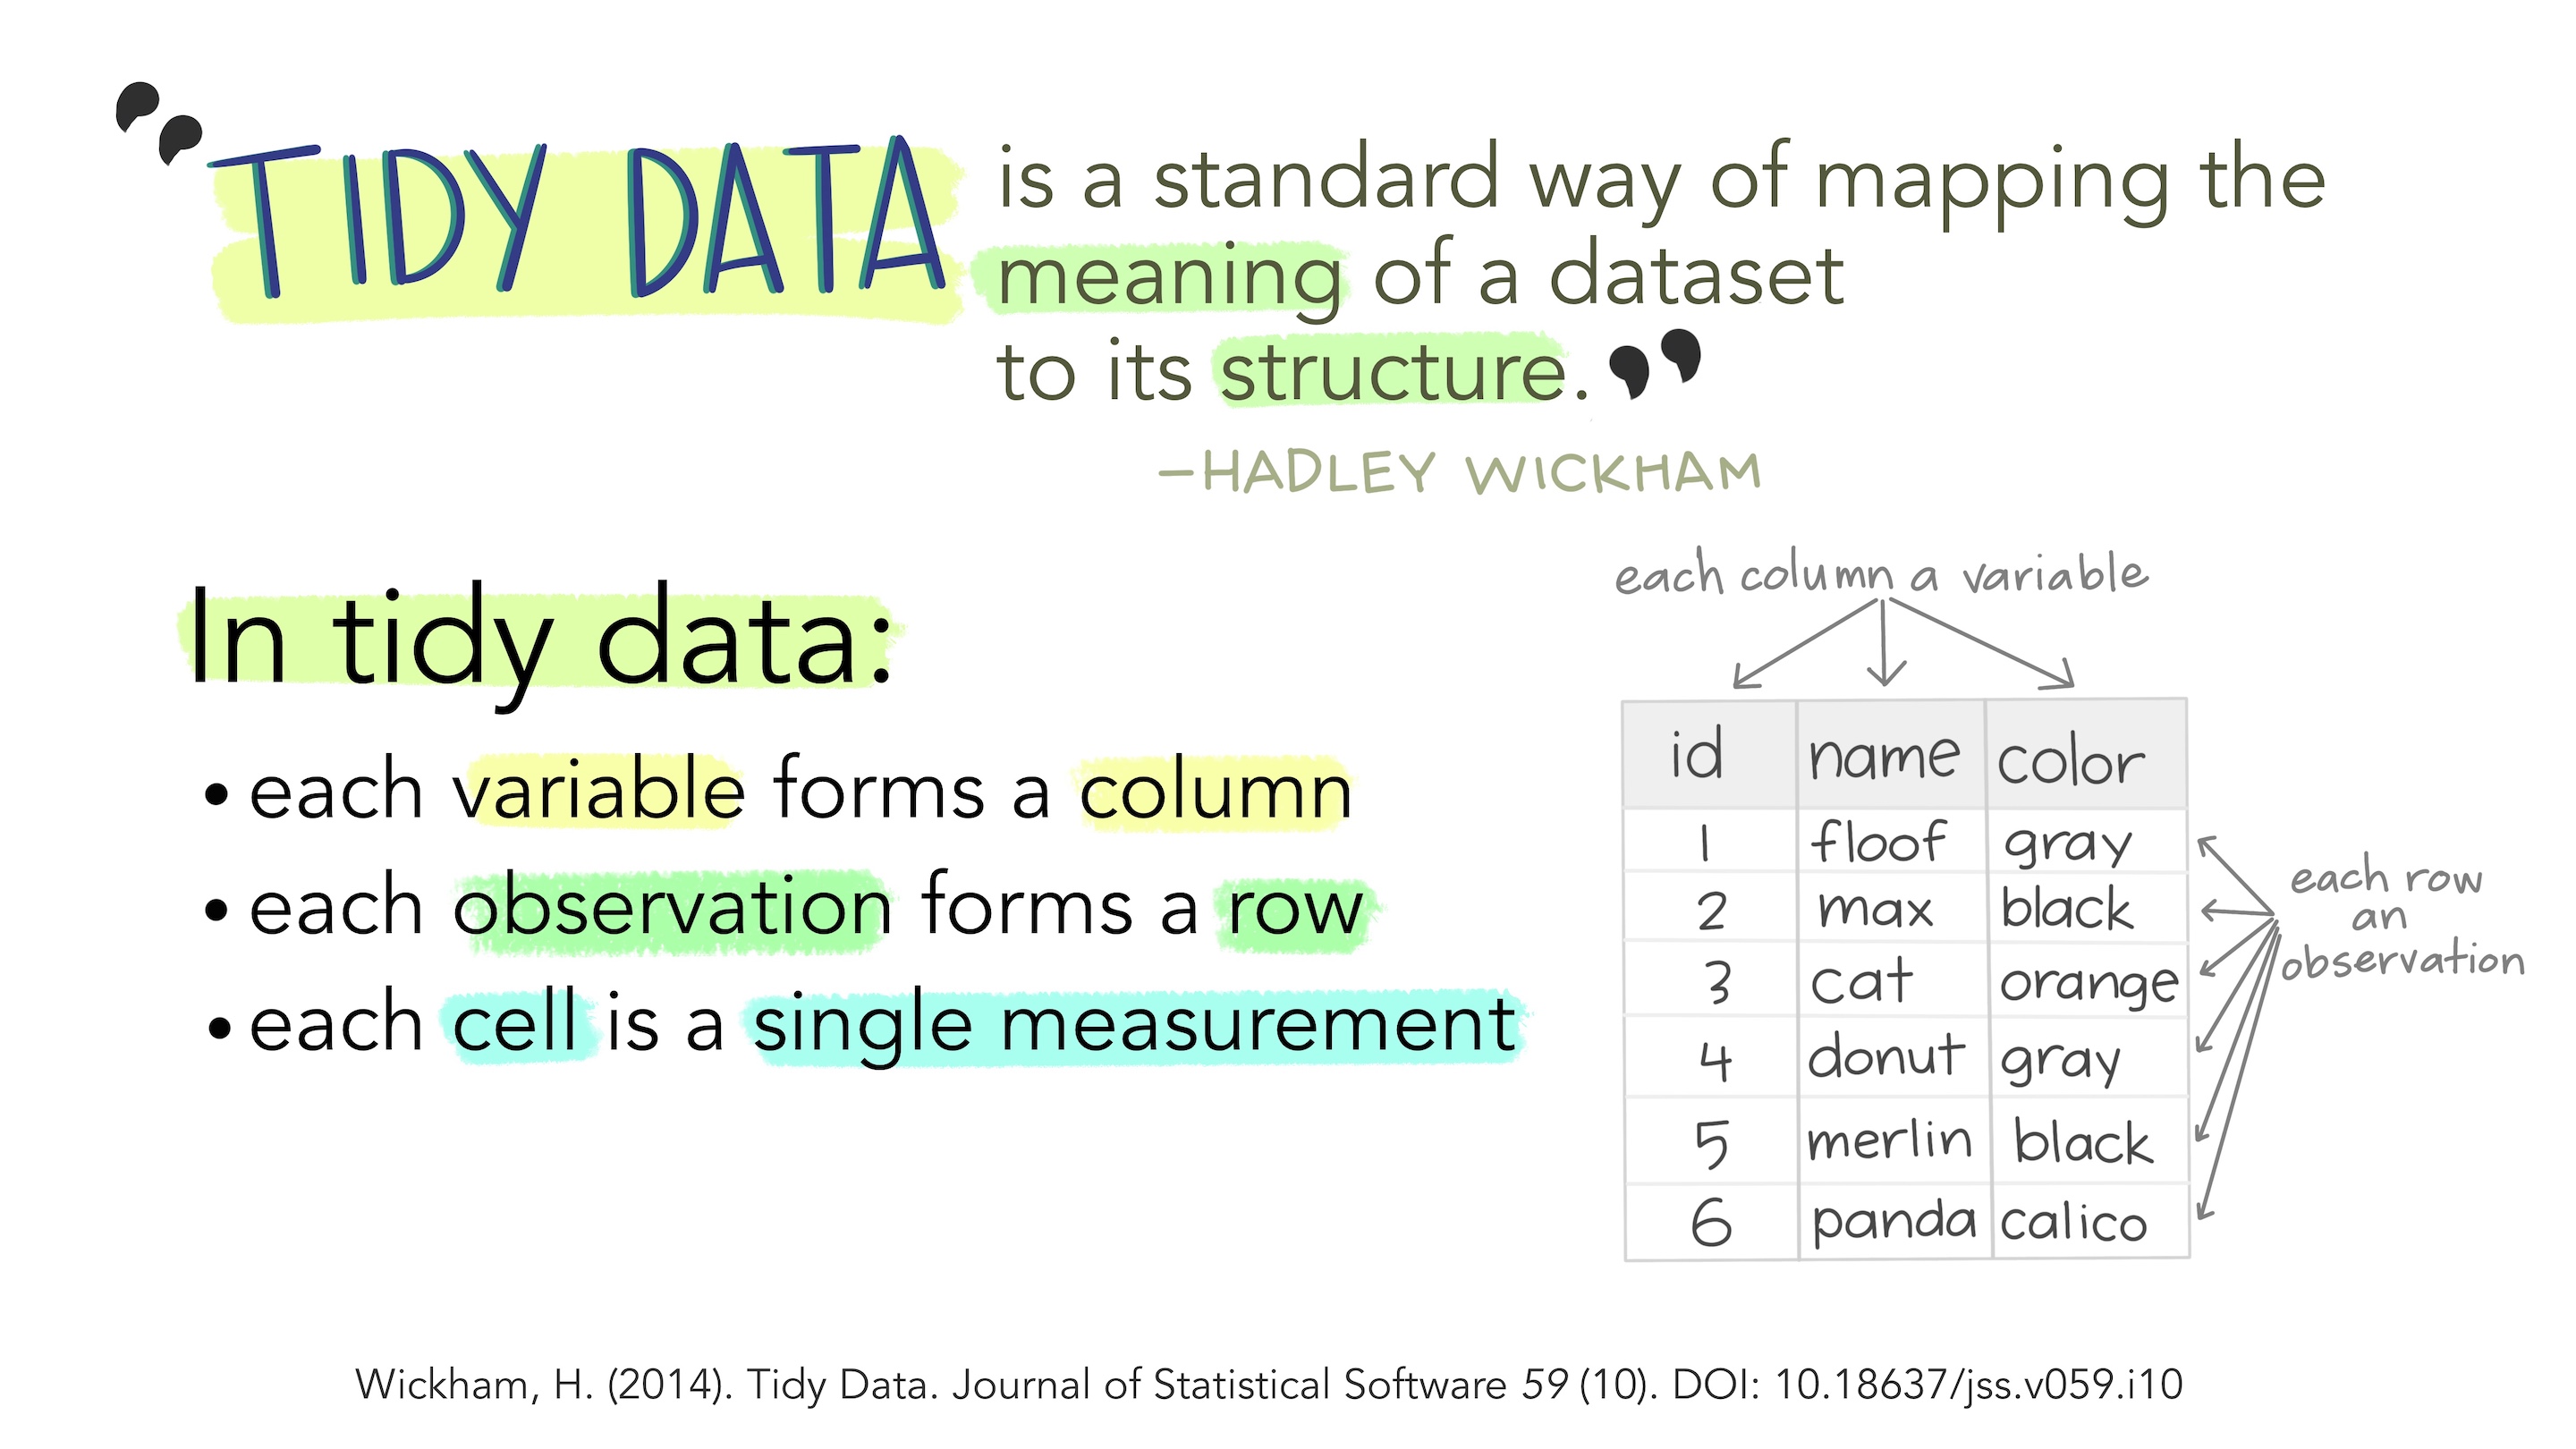
The tidyverse facilitates the creation and use of tidy data. If you can get your data to this format (and we will see ways to do this), your life will be much easier:

Source: Illustrations from the Openscapes blog Tidy Data for reproducibility, efficiency, and collaboration by Julia Lowndes and Allison Horst.

Wrangling data with dplyr

We often need to modify data to conduct our analyses, e.g., creating columns, filtering rows, etc. In the tidyverse, these operations are conducted with multiple verbs, which we will review now.

Selecting columns

We can select specific columns in our dataset with the select() function. All dplyr wrangling verbs take a data frame as their first argument—in this case, the columns we want to select are the other arguments.

select(penguins_raw, Species, Island, `Individual ID`)
# A tibble: 344 × 3
   Species                             Island    `Individual ID`
   <chr>                               <chr>     <chr>          
 1 Adelie Penguin (Pygoscelis adeliae) Torgersen N1A1           
 2 Adelie Penguin (Pygoscelis adeliae) Torgersen N1A2           
 3 Adelie Penguin (Pygoscelis adeliae) Torgersen N2A1           
 4 Adelie Penguin (Pygoscelis adeliae) Torgersen N2A2           
 5 Adelie Penguin (Pygoscelis adeliae) Torgersen N3A1           
 6 Adelie Penguin (Pygoscelis adeliae) Torgersen N3A2           
 7 Adelie Penguin (Pygoscelis adeliae) Torgersen N4A1           
 8 Adelie Penguin (Pygoscelis adeliae) Torgersen N4A2           
 9 Adelie Penguin (Pygoscelis adeliae) Torgersen N5A1           
10 Adelie Penguin (Pygoscelis adeliae) Torgersen N5A2           
# ℹ 334 more rows

This is a good moment to talk about “pipes.” Notice how the code below produces the same output as the one above, but with a slightly different syntax. Pipes (|> or %>%) “kick” the object on the left of the pipe to the first argument of the function on the right. One can read pipes as “then,” so the code below can be read as “take penguins_raw, then select the columns Species, Island and Individual ID.” Pipes are very powerful and can be used to link multiple operations, as we will see in a moment.

penguins_raw |> 
  select(Species, Island, `Individual ID`) 
# A tibble: 344 × 3
   Species                             Island    `Individual ID`
   <chr>                               <chr>     <chr>          
 1 Adelie Penguin (Pygoscelis adeliae) Torgersen N1A1           
 2 Adelie Penguin (Pygoscelis adeliae) Torgersen N1A2           
 3 Adelie Penguin (Pygoscelis adeliae) Torgersen N2A1           
 4 Adelie Penguin (Pygoscelis adeliae) Torgersen N2A2           
 5 Adelie Penguin (Pygoscelis adeliae) Torgersen N3A1           
 6 Adelie Penguin (Pygoscelis adeliae) Torgersen N3A2           
 7 Adelie Penguin (Pygoscelis adeliae) Torgersen N4A1           
 8 Adelie Penguin (Pygoscelis adeliae) Torgersen N4A2           
 9 Adelie Penguin (Pygoscelis adeliae) Torgersen N5A1           
10 Adelie Penguin (Pygoscelis adeliae) Torgersen N5A2           
# ℹ 334 more rows
Tip

You can insert a pipe with the Cmd/Ctrl + Shift + M shortcut. If you have not changed the default RStudio settings, an “old” pipe (%>%) might appear. While most of the functionality is the same, the |> “new” pipes are more readable and don’t need any extra packages (to use %>% you need the tidyverse or one of its packages). You can change this RStudio option in Tools > Global Options > Code > Use native pipe operator.

Going back to selecting columns, you can select ranges:

penguins_raw |> 
  select(Species:`Individual ID`)
# A tibble: 344 × 5
   Species                             Region Island    Stage    `Individual ID`
   <chr>                               <chr>  <chr>     <chr>    <chr>          
 1 Adelie Penguin (Pygoscelis adeliae) Anvers Torgersen Adult, … N1A1           
 2 Adelie Penguin (Pygoscelis adeliae) Anvers Torgersen Adult, … N1A2           
 3 Adelie Penguin (Pygoscelis adeliae) Anvers Torgersen Adult, … N2A1           
 4 Adelie Penguin (Pygoscelis adeliae) Anvers Torgersen Adult, … N2A2           
 5 Adelie Penguin (Pygoscelis adeliae) Anvers Torgersen Adult, … N3A1           
 6 Adelie Penguin (Pygoscelis adeliae) Anvers Torgersen Adult, … N3A2           
 7 Adelie Penguin (Pygoscelis adeliae) Anvers Torgersen Adult, … N4A1           
 8 Adelie Penguin (Pygoscelis adeliae) Anvers Torgersen Adult, … N4A2           
 9 Adelie Penguin (Pygoscelis adeliae) Anvers Torgersen Adult, … N5A1           
10 Adelie Penguin (Pygoscelis adeliae) Anvers Torgersen Adult, … N5A2           
# ℹ 334 more rows

You can also deselect columns using a minus sign:

penguins_raw |> 
  select(-Species)
# A tibble: 344 × 16
   studyName `Sample Number` Region Island    Stage              `Individual ID`
   <chr>               <dbl> <chr>  <chr>     <chr>              <chr>          
 1 PAL0708                 1 Anvers Torgersen Adult, 1 Egg Stage N1A1           
 2 PAL0708                 2 Anvers Torgersen Adult, 1 Egg Stage N1A2           
 3 PAL0708                 3 Anvers Torgersen Adult, 1 Egg Stage N2A1           
 4 PAL0708                 4 Anvers Torgersen Adult, 1 Egg Stage N2A2           
 5 PAL0708                 5 Anvers Torgersen Adult, 1 Egg Stage N3A1           
 6 PAL0708                 6 Anvers Torgersen Adult, 1 Egg Stage N3A2           
 7 PAL0708                 7 Anvers Torgersen Adult, 1 Egg Stage N4A1           
 8 PAL0708                 8 Anvers Torgersen Adult, 1 Egg Stage N4A2           
 9 PAL0708                 9 Anvers Torgersen Adult, 1 Egg Stage N5A1           
10 PAL0708                10 Anvers Torgersen Adult, 1 Egg Stage N5A2           
# ℹ 334 more rows
# ℹ 10 more variables: `Clutch Completion` <chr>, `Date Egg` <date>,
#   `Culmen Length (mm)` <dbl>, `Culmen Depth (mm)` <dbl>,
#   `Flipper Length (mm)` <dbl>, `Body Mass (g)` <dbl>, Sex <chr>,
#   `Delta 15 N (o/oo)` <dbl>, `Delta 13 C (o/oo)` <dbl>, Comments <chr>

And use a few helper functions, like matches():

penguins_raw |> 
  select(Species, matches("Length"))
# A tibble: 344 × 3
   Species                            `Culmen Length (mm)` `Flipper Length (mm)`
   <chr>                                             <dbl>                 <dbl>
 1 Adelie Penguin (Pygoscelis adelia…                 39.1                   181
 2 Adelie Penguin (Pygoscelis adelia…                 39.5                   186
 3 Adelie Penguin (Pygoscelis adelia…                 40.3                   195
 4 Adelie Penguin (Pygoscelis adelia…                 NA                      NA
 5 Adelie Penguin (Pygoscelis adelia…                 36.7                   193
 6 Adelie Penguin (Pygoscelis adelia…                 39.3                   190
 7 Adelie Penguin (Pygoscelis adelia…                 38.9                   181
 8 Adelie Penguin (Pygoscelis adelia…                 39.2                   195
 9 Adelie Penguin (Pygoscelis adelia…                 34.1                   193
10 Adelie Penguin (Pygoscelis adelia…                 42                     190
# ℹ 334 more rows

Or everything(), which we usually use to reorder columns:

penguins_raw |> 
  select(Species, everything())
# A tibble: 344 × 17
   Species         studyName `Sample Number` Region Island Stage `Individual ID`
   <chr>           <chr>               <dbl> <chr>  <chr>  <chr> <chr>          
 1 Adelie Penguin… PAL0708                 1 Anvers Torge… Adul… N1A1           
 2 Adelie Penguin… PAL0708                 2 Anvers Torge… Adul… N1A2           
 3 Adelie Penguin… PAL0708                 3 Anvers Torge… Adul… N2A1           
 4 Adelie Penguin… PAL0708                 4 Anvers Torge… Adul… N2A2           
 5 Adelie Penguin… PAL0708                 5 Anvers Torge… Adul… N3A1           
 6 Adelie Penguin… PAL0708                 6 Anvers Torge… Adul… N3A2           
 7 Adelie Penguin… PAL0708                 7 Anvers Torge… Adul… N4A1           
 8 Adelie Penguin… PAL0708                 8 Anvers Torge… Adul… N4A2           
 9 Adelie Penguin… PAL0708                 9 Anvers Torge… Adul… N5A1           
10 Adelie Penguin… PAL0708                10 Anvers Torge… Adul… N5A2           
# ℹ 334 more rows
# ℹ 10 more variables: `Clutch Completion` <chr>, `Date Egg` <date>,
#   `Culmen Length (mm)` <dbl>, `Culmen Depth (mm)` <dbl>,
#   `Flipper Length (mm)` <dbl>, `Body Mass (g)` <dbl>, Sex <chr>,
#   `Delta 15 N (o/oo)` <dbl>, `Delta 13 C (o/oo)` <dbl>, Comments <chr>
Tip

Notice that all these commands have not edited our existent objects—they have just printed the requested outputs to the screen. In order to modify objects, you need to use the assignment operator (<-). For example:

penguins_raw_reduced <- penguins_raw |> 
  select(Species, matches("Length"))
penguins_raw_reduced
# A tibble: 344 × 3
   Species                            `Culmen Length (mm)` `Flipper Length (mm)`
   <chr>                                             <dbl>                 <dbl>
 1 Adelie Penguin (Pygoscelis adelia…                 39.1                   181
 2 Adelie Penguin (Pygoscelis adelia…                 39.5                   186
 3 Adelie Penguin (Pygoscelis adelia…                 40.3                   195
 4 Adelie Penguin (Pygoscelis adelia…                 NA                      NA
 5 Adelie Penguin (Pygoscelis adelia…                 36.7                   193
 6 Adelie Penguin (Pygoscelis adelia…                 39.3                   190
 7 Adelie Penguin (Pygoscelis adelia…                 38.9                   181
 8 Adelie Penguin (Pygoscelis adelia…                 39.2                   195
 9 Adelie Penguin (Pygoscelis adelia…                 34.1                   193
10 Adelie Penguin (Pygoscelis adelia…                 42                     190
# ℹ 334 more rows
Exercise

Select the variables Species, Stage, Individual ID, Clutch Completion, and Date Egg from the data frame.

penguins_raw |> 
  select(Species, Stage, `Individual ID`, `Clutch Completion`, `Date Egg`)
# A tibble: 344 × 5
   Species                  Stage `Individual ID` `Clutch Completion` `Date Egg`
   <chr>                    <chr> <chr>           <chr>               <date>    
 1 Adelie Penguin (Pygosce… Adul… N1A1            Yes                 2007-11-11
 2 Adelie Penguin (Pygosce… Adul… N1A2            Yes                 2007-11-11
 3 Adelie Penguin (Pygosce… Adul… N2A1            Yes                 2007-11-16
 4 Adelie Penguin (Pygosce… Adul… N2A2            Yes                 2007-11-16
 5 Adelie Penguin (Pygosce… Adul… N3A1            Yes                 2007-11-16
 6 Adelie Penguin (Pygosce… Adul… N3A2            Yes                 2007-11-16
 7 Adelie Penguin (Pygosce… Adul… N4A1            No                  2007-11-15
 8 Adelie Penguin (Pygosce… Adul… N4A2            No                  2007-11-15
 9 Adelie Penguin (Pygosce… Adul… N5A1            Yes                 2007-11-09
10 Adelie Penguin (Pygosce… Adul… N5A2            Yes                 2007-11-09
# ℹ 334 more rows

Renaming columns

We can use the rename() function to rename columns, with the syntax new_name = old_name. This is especially useful for datasets like this one, where the column names are long, have spaces in them, or other special characters that require ` in order to call the column name. Here is an example of how we rename a column:

penguins_raw |> 
  rename(id = `Individual ID`, 
         flipper_length = `Flipper Length (mm)`)
# A tibble: 344 × 17
   studyName `Sample Number` Species                   Region Island Stage id   
   <chr>               <dbl> <chr>                     <chr>  <chr>  <chr> <chr>
 1 PAL0708                 1 Adelie Penguin (Pygoscel… Anvers Torge… Adul… N1A1 
 2 PAL0708                 2 Adelie Penguin (Pygoscel… Anvers Torge… Adul… N1A2 
 3 PAL0708                 3 Adelie Penguin (Pygoscel… Anvers Torge… Adul… N2A1 
 4 PAL0708                 4 Adelie Penguin (Pygoscel… Anvers Torge… Adul… N2A2 
 5 PAL0708                 5 Adelie Penguin (Pygoscel… Anvers Torge… Adul… N3A1 
 6 PAL0708                 6 Adelie Penguin (Pygoscel… Anvers Torge… Adul… N3A2 
 7 PAL0708                 7 Adelie Penguin (Pygoscel… Anvers Torge… Adul… N4A1 
 8 PAL0708                 8 Adelie Penguin (Pygoscel… Anvers Torge… Adul… N4A2 
 9 PAL0708                 9 Adelie Penguin (Pygoscel… Anvers Torge… Adul… N5A1 
10 PAL0708                10 Adelie Penguin (Pygoscel… Anvers Torge… Adul… N5A2 
# ℹ 334 more rows
# ℹ 10 more variables: `Clutch Completion` <chr>, `Date Egg` <date>,
#   `Culmen Length (mm)` <dbl>, `Culmen Depth (mm)` <dbl>,
#   flipper_length <dbl>, `Body Mass (g)` <dbl>, Sex <chr>,
#   `Delta 15 N (o/oo)` <dbl>, `Delta 13 C (o/oo)` <dbl>, Comments <chr>

This is a good occasion to show how pipes allow us to chain operations. How do we read the following code out loud? (Remember that pipes are read as “then”).

penguins_raw |> 
  select(Species, `Individual ID`, matches("Length")) |> 
  rename(id = `Individual ID`, 
         flipper_length = `Flipper Length (mm)`)
# A tibble: 344 × 4
   Species                             id    `Culmen Length (mm)` flipper_length
   <chr>                               <chr>                <dbl>          <dbl>
 1 Adelie Penguin (Pygoscelis adeliae) N1A1                  39.1            181
 2 Adelie Penguin (Pygoscelis adeliae) N1A2                  39.5            186
 3 Adelie Penguin (Pygoscelis adeliae) N2A1                  40.3            195
 4 Adelie Penguin (Pygoscelis adeliae) N2A2                  NA               NA
 5 Adelie Penguin (Pygoscelis adeliae) N3A1                  36.7            193
 6 Adelie Penguin (Pygoscelis adeliae) N3A2                  39.3            190
 7 Adelie Penguin (Pygoscelis adeliae) N4A1                  38.9            181
 8 Adelie Penguin (Pygoscelis adeliae) N4A2                  39.2            195
 9 Adelie Penguin (Pygoscelis adeliae) N5A1                  34.1            193
10 Adelie Penguin (Pygoscelis adeliae) N5A2                  42              190
# ℹ 334 more rows

Creating columns

It is common to want to create columns based on existing ones. We can use mutate() to do so. For example, we could want to express the main length variables (length of the penguin’s flipper and culmen, the dorsal ridge of their bill) in centimeters instead of millimeters:

penguins_raw |> 
  select(Species, matches("Length")) |> # select just for clarity
    rename(flipper_length = `Flipper Length (mm)`) |>
  #mutate length variables
  mutate(flipper_length_cm = flipper_length * 0.1,
         culmen_length_cm = `Culmen Length (mm)` * 0.1)
# A tibble: 344 × 5
   Species                 `Culmen Length (mm)` flipper_length flipper_length_cm
   <chr>                                  <dbl>          <dbl>             <dbl>
 1 Adelie Penguin (Pygosc…                 39.1            181              18.1
 2 Adelie Penguin (Pygosc…                 39.5            186              18.6
 3 Adelie Penguin (Pygosc…                 40.3            195              19.5
 4 Adelie Penguin (Pygosc…                 NA               NA              NA  
 5 Adelie Penguin (Pygosc…                 36.7            193              19.3
 6 Adelie Penguin (Pygosc…                 39.3            190              19  
 7 Adelie Penguin (Pygosc…                 38.9            181              18.1
 8 Adelie Penguin (Pygosc…                 39.2            195              19.5
 9 Adelie Penguin (Pygosc…                 34.1            193              19.3
10 Adelie Penguin (Pygosc…                 42              190              19  
# ℹ 334 more rows
# ℹ 1 more variable: culmen_length_cm <dbl>

We can also use multiple columns for creating a new one. For example, let’s calculate the flipper to culmen length ratio:

penguins_raw |> 
 select(Species,  matches("Length")) |> # select just for clarity
    rename(flipper_length = `Flipper Length (mm)`) |>
  mutate(flipper_culmen_ratio = flipper_length/`Culmen Length (mm)`)
# A tibble: 344 × 4
   Species              `Culmen Length (mm)` flipper_length flipper_culmen_ratio
   <chr>                               <dbl>          <dbl>                <dbl>
 1 Adelie Penguin (Pyg…                 39.1            181                 4.63
 2 Adelie Penguin (Pyg…                 39.5            186                 4.71
 3 Adelie Penguin (Pyg…                 40.3            195                 4.84
 4 Adelie Penguin (Pyg…                 NA               NA                NA   
 5 Adelie Penguin (Pyg…                 36.7            193                 5.26
 6 Adelie Penguin (Pyg…                 39.3            190                 4.83
 7 Adelie Penguin (Pyg…                 38.9            181                 4.65
 8 Adelie Penguin (Pyg…                 39.2            195                 4.97
 9 Adelie Penguin (Pyg…                 34.1            193                 5.66
10 Adelie Penguin (Pyg…                 42              190                 4.52
# ℹ 334 more rows

Filtering rows

Another common operation is to filter rows based on logical conditions. We can do so with the filter() function. For example, we can filter to only get penguins of a certain species:

penguins_raw |> 
  filter(Species == "Gentoo penguin (Pygoscelis papua)")
# A tibble: 124 × 17
   studyName `Sample Number` Species         Region Island Stage `Individual ID`
   <chr>               <dbl> <chr>           <chr>  <chr>  <chr> <chr>          
 1 PAL0708                 1 Gentoo penguin… Anvers Biscoe Adul… N31A1          
 2 PAL0708                 2 Gentoo penguin… Anvers Biscoe Adul… N31A2          
 3 PAL0708                 3 Gentoo penguin… Anvers Biscoe Adul… N32A1          
 4 PAL0708                 4 Gentoo penguin… Anvers Biscoe Adul… N32A2          
 5 PAL0708                 5 Gentoo penguin… Anvers Biscoe Adul… N33A1          
 6 PAL0708                 6 Gentoo penguin… Anvers Biscoe Adul… N33A2          
 7 PAL0708                 7 Gentoo penguin… Anvers Biscoe Adul… N34A1          
 8 PAL0708                 8 Gentoo penguin… Anvers Biscoe Adul… N34A2          
 9 PAL0708                 9 Gentoo penguin… Anvers Biscoe Adul… N35A1          
10 PAL0708                10 Gentoo penguin… Anvers Biscoe Adul… N35A2          
# ℹ 114 more rows
# ℹ 10 more variables: `Clutch Completion` <chr>, `Date Egg` <date>,
#   `Culmen Length (mm)` <dbl>, `Culmen Depth (mm)` <dbl>,
#   `Flipper Length (mm)` <dbl>, `Body Mass (g)` <dbl>, Sex <chr>,
#   `Delta 15 N (o/oo)` <dbl>, `Delta 13 C (o/oo)` <dbl>, Comments <chr>

Notice that == here is a logical operator, read as “is equal to.” So our full chain of operations says the following: take penguins_raw, then filter it to get rows where the Species is equal to “Gentoo penguin (Pygoscelis papua)”.

There are other logical operators, also called boolean operators:

Logical operator Meaning
== “is equal to”
!= “is not equal to”
> “is greater than”
< “is less than”
>= “is greater than or equal to”
<= “is less than or equal to”
%in% “is contained in”
& “and” (intersection)
| “or” (union)

Let’s see a couple of other examples.

penguins_raw |> 
  filter(Island %in% c("Torgersen", "Biscoe"))
# A tibble: 220 × 17
   studyName `Sample Number` Species         Region Island Stage `Individual ID`
   <chr>               <dbl> <chr>           <chr>  <chr>  <chr> <chr>          
 1 PAL0708                 1 Adelie Penguin… Anvers Torge… Adul… N1A1           
 2 PAL0708                 2 Adelie Penguin… Anvers Torge… Adul… N1A2           
 3 PAL0708                 3 Adelie Penguin… Anvers Torge… Adul… N2A1           
 4 PAL0708                 4 Adelie Penguin… Anvers Torge… Adul… N2A2           
 5 PAL0708                 5 Adelie Penguin… Anvers Torge… Adul… N3A1           
 6 PAL0708                 6 Adelie Penguin… Anvers Torge… Adul… N3A2           
 7 PAL0708                 7 Adelie Penguin… Anvers Torge… Adul… N4A1           
 8 PAL0708                 8 Adelie Penguin… Anvers Torge… Adul… N4A2           
 9 PAL0708                 9 Adelie Penguin… Anvers Torge… Adul… N5A1           
10 PAL0708                10 Adelie Penguin… Anvers Torge… Adul… N5A2           
# ℹ 210 more rows
# ℹ 10 more variables: `Clutch Completion` <chr>, `Date Egg` <date>,
#   `Culmen Length (mm)` <dbl>, `Culmen Depth (mm)` <dbl>,
#   `Flipper Length (mm)` <dbl>, `Body Mass (g)` <dbl>, Sex <chr>,
#   `Delta 15 N (o/oo)` <dbl>, `Delta 13 C (o/oo)` <dbl>, Comments <chr>
penguins_raw |> 
  filter(Island == "Torgersen" & Sex == "MALE")
# A tibble: 23 × 17
   studyName `Sample Number` Species         Region Island Stage `Individual ID`
   <chr>               <dbl> <chr>           <chr>  <chr>  <chr> <chr>          
 1 PAL0708                 1 Adelie Penguin… Anvers Torge… Adul… N1A1           
 2 PAL0708                 6 Adelie Penguin… Anvers Torge… Adul… N3A2           
 3 PAL0708                 8 Adelie Penguin… Anvers Torge… Adul… N4A2           
 4 PAL0708                14 Adelie Penguin… Anvers Torge… Adul… N7A2           
 5 PAL0708                15 Adelie Penguin… Anvers Torge… Adul… N8A1           
 6 PAL0708                18 Adelie Penguin… Anvers Torge… Adul… N9A2           
 7 PAL0708                20 Adelie Penguin… Anvers Torge… Adul… N10A2          
 8 PAL0809                70 Adelie Penguin… Anvers Torge… Adul… N32A2          
 9 PAL0809                72 Adelie Penguin… Anvers Torge… Adul… N34A2          
10 PAL0809                74 Adelie Penguin… Anvers Torge… Adul… N35A2          
# ℹ 13 more rows
# ℹ 10 more variables: `Clutch Completion` <chr>, `Date Egg` <date>,
#   `Culmen Length (mm)` <dbl>, `Culmen Depth (mm)` <dbl>,
#   `Flipper Length (mm)` <dbl>, `Body Mass (g)` <dbl>, Sex <chr>,
#   `Delta 15 N (o/oo)` <dbl>, `Delta 13 C (o/oo)` <dbl>, Comments <chr>
penguins_raw |> 
  filter(`Flipper Length (mm)` > 200)
# A tibble: 148 × 17
   studyName `Sample Number` Species         Region Island Stage `Individual ID`
   <chr>               <dbl> <chr>           <chr>  <chr>  <chr> <chr>          
 1 PAL0809                91 Adelie Penguin… Anvers Dream  Adul… N45A1          
 2 PAL0809                92 Adelie Penguin… Anvers Dream  Adul… N45A2          
 3 PAL0809                96 Adelie Penguin… Anvers Dream  Adul… N48A2          
 4 PAL0910               102 Adelie Penguin… Anvers Biscoe Adul… N47A2          
 5 PAL0910               124 Adelie Penguin… Anvers Torge… Adul… N67A2          
 6 PAL0910               130 Adelie Penguin… Anvers Torge… Adul… N72A2          
 7 PAL0910               152 Adelie Penguin… Anvers Dream  Adul… N85A2          
 8 PAL0708                 1 Gentoo penguin… Anvers Biscoe Adul… N31A1          
 9 PAL0708                 2 Gentoo penguin… Anvers Biscoe Adul… N31A2          
10 PAL0708                 3 Gentoo penguin… Anvers Biscoe Adul… N32A1          
# ℹ 138 more rows
# ℹ 10 more variables: `Clutch Completion` <chr>, `Date Egg` <date>,
#   `Culmen Length (mm)` <dbl>, `Culmen Depth (mm)` <dbl>,
#   `Flipper Length (mm)` <dbl>, `Body Mass (g)` <dbl>, Sex <chr>,
#   `Delta 15 N (o/oo)` <dbl>, `Delta 13 C (o/oo)` <dbl>, Comments <chr>
Tip

Confused about when to use filter() and when to use select()? You use filter() to select rows (i.e., specific observations) with specific attributes, and you use select() to select columns (i.e., specific variables). To help keep it straight, remember that the letter “c” for column is in select() and the letter “r” for row is in filter().

Exercise
  1. Add a new column to the data frame, called length_mass_ratio, which calculates the ratio of the penguin’s flipper length Flipper Length (mm) and their body mass Body Mass (g). How would you calculate length_cm_mass_ratio, where the flipper length is expressed as centimeters instead of millimeters?

To calculate length_mass_ratio:

## Length to mass ratio:
penguins_raw |> 
 select(Species, `Body Mass (g)`, matches("Length")) |> # select just for clarity
    rename(flipper_length = `Flipper Length (mm)`) |>
  mutate(length_mass_ratio = flipper_length/`Body Mass (g)`)
# A tibble: 344 × 5
   Species `Body Mass (g)` `Culmen Length (mm)` flipper_length length_mass_ratio
   <chr>             <dbl>                <dbl>          <dbl>             <dbl>
 1 Adelie…            3750                 39.1            181            0.0483
 2 Adelie…            3800                 39.5            186            0.0489
 3 Adelie…            3250                 40.3            195            0.06  
 4 Adelie…              NA                 NA               NA           NA     
 5 Adelie…            3450                 36.7            193            0.0559
 6 Adelie…            3650                 39.3            190            0.0521
 7 Adelie…            3625                 38.9            181            0.0499
 8 Adelie…            4675                 39.2            195            0.0417
 9 Adelie…            3475                 34.1            193            0.0555
10 Adelie…            4250                 42              190            0.0447
# ℹ 334 more rows

There are two ways to calculate length_cm_mass_ratio in centimeters, you could either generate a new length variable in centimeters, or just apply the unit transformation to the ratio equation:

penguins_raw |> 
 select(Species, `Body Mass (g)`, matches("Length")) |> # select just for clarity
    rename(flipper_length = `Flipper Length (mm)`) |>
  mutate(flipper_cm = flipper_length * 0.1, 
      length_cm_mass_ratio = flipper_cm/`Body Mass (g)`)
# A tibble: 344 × 6
   Species        `Body Mass (g)` `Culmen Length (mm)` flipper_length flipper_cm
   <chr>                    <dbl>                <dbl>          <dbl>      <dbl>
 1 Adelie Pengui…            3750                 39.1            181       18.1
 2 Adelie Pengui…            3800                 39.5            186       18.6
 3 Adelie Pengui…            3250                 40.3            195       19.5
 4 Adelie Pengui…              NA                 NA               NA       NA  
 5 Adelie Pengui…            3450                 36.7            193       19.3
 6 Adelie Pengui…            3650                 39.3            190       19  
 7 Adelie Pengui…            3625                 38.9            181       18.1
 8 Adelie Pengui…            4675                 39.2            195       19.5
 9 Adelie Pengui…            3475                 34.1            193       19.3
10 Adelie Pengui…            4250                 42              190       19  
# ℹ 334 more rows
# ℹ 1 more variable: length_cm_mass_ratio <dbl>
penguins_raw |> 
 select(Species, `Body Mass (g)`, matches("Length")) |> # select just for clarity
    rename(flipper_length = `Flipper Length (mm)`) |>
  mutate(length_cm_mass_ratio = flipper_length/`Body Mass (g)` * 0.1)
# A tibble: 344 × 5
   Species                   `Body Mass (g)` `Culmen Length (mm)` flipper_length
   <chr>                               <dbl>                <dbl>          <dbl>
 1 Adelie Penguin (Pygoscel…            3750                 39.1            181
 2 Adelie Penguin (Pygoscel…            3800                 39.5            186
 3 Adelie Penguin (Pygoscel…            3250                 40.3            195
 4 Adelie Penguin (Pygoscel…              NA                 NA               NA
 5 Adelie Penguin (Pygoscel…            3450                 36.7            193
 6 Adelie Penguin (Pygoscel…            3650                 39.3            190
 7 Adelie Penguin (Pygoscel…            3625                 38.9            181
 8 Adelie Penguin (Pygoscel…            4675                 39.2            195
 9 Adelie Penguin (Pygoscel…            3475                 34.1            193
10 Adelie Penguin (Pygoscel…            4250                 42              190
# ℹ 334 more rows
# ℹ 1 more variable: length_cm_mass_ratio <dbl>
  1. Filter the data frame to only get penguins with nests observed with a fully completed clutch.
penguins_raw |> 
  filter(`Clutch Completion` == "Yes")
# A tibble: 308 × 17
   studyName `Sample Number` Species         Region Island Stage `Individual ID`
   <chr>               <dbl> <chr>           <chr>  <chr>  <chr> <chr>          
 1 PAL0708                 1 Adelie Penguin… Anvers Torge… Adul… N1A1           
 2 PAL0708                 2 Adelie Penguin… Anvers Torge… Adul… N1A2           
 3 PAL0708                 3 Adelie Penguin… Anvers Torge… Adul… N2A1           
 4 PAL0708                 4 Adelie Penguin… Anvers Torge… Adul… N2A2           
 5 PAL0708                 5 Adelie Penguin… Anvers Torge… Adul… N3A1           
 6 PAL0708                 6 Adelie Penguin… Anvers Torge… Adul… N3A2           
 7 PAL0708                 9 Adelie Penguin… Anvers Torge… Adul… N5A1           
 8 PAL0708                10 Adelie Penguin… Anvers Torge… Adul… N5A2           
 9 PAL0708                11 Adelie Penguin… Anvers Torge… Adul… N6A1           
10 PAL0708                12 Adelie Penguin… Anvers Torge… Adul… N6A2           
# ℹ 298 more rows
# ℹ 10 more variables: `Clutch Completion` <chr>, `Date Egg` <date>,
#   `Culmen Length (mm)` <dbl>, `Culmen Depth (mm)` <dbl>,
#   `Flipper Length (mm)` <dbl>, `Body Mass (g)` <dbl>, Sex <chr>,
#   `Delta 15 N (o/oo)` <dbl>, `Delta 13 C (o/oo)` <dbl>, Comments <chr>
  1. Filter the data frame to only get penguins with nests observed with a fully completed clutch on the Island of Torgersen.
penguins_raw |> 
  filter(`Clutch Completion` == "Yes" & Island == "Torgersen")
# A tibble: 44 × 17
   studyName `Sample Number` Species         Region Island Stage `Individual ID`
   <chr>               <dbl> <chr>           <chr>  <chr>  <chr> <chr>          
 1 PAL0708                 1 Adelie Penguin… Anvers Torge… Adul… N1A1           
 2 PAL0708                 2 Adelie Penguin… Anvers Torge… Adul… N1A2           
 3 PAL0708                 3 Adelie Penguin… Anvers Torge… Adul… N2A1           
 4 PAL0708                 4 Adelie Penguin… Anvers Torge… Adul… N2A2           
 5 PAL0708                 5 Adelie Penguin… Anvers Torge… Adul… N3A1           
 6 PAL0708                 6 Adelie Penguin… Anvers Torge… Adul… N3A2           
 7 PAL0708                 9 Adelie Penguin… Anvers Torge… Adul… N5A1           
 8 PAL0708                10 Adelie Penguin… Anvers Torge… Adul… N5A2           
 9 PAL0708                11 Adelie Penguin… Anvers Torge… Adul… N6A1           
10 PAL0708                12 Adelie Penguin… Anvers Torge… Adul… N6A2           
# ℹ 34 more rows
# ℹ 10 more variables: `Clutch Completion` <chr>, `Date Egg` <date>,
#   `Culmen Length (mm)` <dbl>, `Culmen Depth (mm)` <dbl>,
#   `Flipper Length (mm)` <dbl>, `Body Mass (g)` <dbl>, Sex <chr>,
#   `Delta 15 N (o/oo)` <dbl>, `Delta 13 C (o/oo)` <dbl>, Comments <chr>

Ordering rows

The arrange() function allows us to order rows according to values. The default arranges from smallest to largest if numeric, or from A to Z if a character. For example, let’s order based on the Body Mass (g) variable:

penguins_raw |> 
  arrange(`Body Mass (g)`)
# A tibble: 344 × 17
   studyName `Sample Number` Species         Region Island Stage `Individual ID`
   <chr>               <dbl> <chr>           <chr>  <chr>  <chr> <chr>          
 1 PAL0809                39 Chinstrap peng… Anvers Dream  Adul… N72A1          
 2 PAL0809                59 Adelie Penguin… Anvers Biscoe Adul… N25A1          
 3 PAL0809                65 Adelie Penguin… Anvers Biscoe Adul… N29A1          
 4 PAL0809                55 Adelie Penguin… Anvers Biscoe Adul… N23A1          
 5 PAL0809                99 Adelie Penguin… Anvers Dream  Adul… N50A1          
 6 PAL0910               117 Adelie Penguin… Anvers Torge… Adul… N63A1          
 7 PAL0708                23 Chinstrap peng… Anvers Dream  Adul… N85A1          
 8 PAL0910               105 Adelie Penguin… Anvers Biscoe Adul… N51A1          
 9 PAL0708                48 Adelie Penguin… Anvers Dream  Adul… N29A2          
10 PAL0708                45 Adelie Penguin… Anvers Dream  Adul… N28A1          
# ℹ 334 more rows
# ℹ 10 more variables: `Clutch Completion` <chr>, `Date Egg` <date>,
#   `Culmen Length (mm)` <dbl>, `Culmen Depth (mm)` <dbl>,
#   `Flipper Length (mm)` <dbl>, `Body Mass (g)` <dbl>, Sex <chr>,
#   `Delta 15 N (o/oo)` <dbl>, `Delta 13 C (o/oo)` <dbl>, Comments <chr>

Maybe we only want penguins from the island of Biscoe. Remember that we can chain operations:

penguins_raw |> 
  filter(Island == "Biscoe") |> 
  arrange(`Body Mass (g)`)
# A tibble: 168 × 17
   studyName `Sample Number` Species         Region Island Stage `Individual ID`
   <chr>               <dbl> <chr>           <chr>  <chr>  <chr> <chr>          
 1 PAL0809                59 Adelie Penguin… Anvers Biscoe Adul… N25A1          
 2 PAL0809                65 Adelie Penguin… Anvers Biscoe Adul… N29A1          
 3 PAL0809                55 Adelie Penguin… Anvers Biscoe Adul… N23A1          
 4 PAL0910               105 Adelie Penguin… Anvers Biscoe Adul… N51A1          
 5 PAL0910               103 Adelie Penguin… Anvers Biscoe Adul… N49A1          
 6 PAL0708                29 Adelie Penguin… Anvers Biscoe Adul… N18A1          
 7 PAL0809                61 Adelie Penguin… Anvers Biscoe Adul… N27A1          
 8 PAL0910               109 Adelie Penguin… Anvers Biscoe Adul… N55A1          
 9 PAL0708                28 Adelie Penguin… Anvers Biscoe Adul… N17A2          
10 PAL0910               113 Adelie Penguin… Anvers Biscoe Adul… N60A1          
# ℹ 158 more rows
# ℹ 10 more variables: `Clutch Completion` <chr>, `Date Egg` <date>,
#   `Culmen Length (mm)` <dbl>, `Culmen Depth (mm)` <dbl>,
#   `Flipper Length (mm)` <dbl>, `Body Mass (g)` <dbl>, Sex <chr>,
#   `Delta 15 N (o/oo)` <dbl>, `Delta 13 C (o/oo)` <dbl>, Comments <chr>

By default, arrange() uses increasing order (like sort()). To use decreasing order, add a minus sign:

penguins_raw |> 
  filter(Island == "Biscoe") |> 
  arrange(-`Body Mass (g)`)
# A tibble: 168 × 17
   studyName `Sample Number` Species         Region Island Stage `Individual ID`
   <chr>               <dbl> <chr>           <chr>  <chr>  <chr> <chr>          
 1 PAL0708                18 Gentoo penguin… Anvers Biscoe Adul… N39A2          
 2 PAL0708                34 Gentoo penguin… Anvers Biscoe Adul… N56A2          
 3 PAL0809                78 Gentoo penguin… Anvers Biscoe Adul… N58A2          
 4 PAL0910               118 Gentoo penguin… Anvers Biscoe Adul… N36A2          
 5 PAL0809                80 Gentoo penguin… Anvers Biscoe Adul… N60A2          
 6 PAL0910               112 Gentoo penguin… Anvers Biscoe Adul… N32A2          
 7 PAL0708                14 Gentoo penguin… Anvers Biscoe Adul… N37A2          
 8 PAL0708                16 Gentoo penguin… Anvers Biscoe Adul… N38A2          
 9 PAL0910               116 Gentoo penguin… Anvers Biscoe Adul… N35A2          
10 PAL0809                68 Gentoo penguin… Anvers Biscoe Adul… N51A2          
# ℹ 158 more rows
# ℹ 10 more variables: `Clutch Completion` <chr>, `Date Egg` <date>,
#   `Culmen Length (mm)` <dbl>, `Culmen Depth (mm)` <dbl>,
#   `Flipper Length (mm)` <dbl>, `Body Mass (g)` <dbl>, Sex <chr>,
#   `Delta 15 N (o/oo)` <dbl>, `Delta 13 C (o/oo)` <dbl>, Comments <chr>

You can also order rows by more than one variable. What this does is to order by the first variable, and resolve any ties by ordering by the second variable (and so forth if you have more than two ordering variables). For example, let’s first order our data frame by sex, and then within sex order by body mass:

penguins_raw |> 
  filter(Island == "Biscoe") |> 
  arrange(Sex, `Body Mass (g)`)
# A tibble: 168 × 17
   studyName `Sample Number` Species         Region Island Stage `Individual ID`
   <chr>               <dbl> <chr>           <chr>  <chr>  <chr> <chr>          
 1 PAL0809                59 Adelie Penguin… Anvers Biscoe Adul… N25A1          
 2 PAL0809                65 Adelie Penguin… Anvers Biscoe Adul… N29A1          
 3 PAL0809                55 Adelie Penguin… Anvers Biscoe Adul… N23A1          
 4 PAL0910               105 Adelie Penguin… Anvers Biscoe Adul… N51A1          
 5 PAL0910               103 Adelie Penguin… Anvers Biscoe Adul… N49A1          
 6 PAL0708                29 Adelie Penguin… Anvers Biscoe Adul… N18A1          
 7 PAL0809                61 Adelie Penguin… Anvers Biscoe Adul… N27A1          
 8 PAL0910               109 Adelie Penguin… Anvers Biscoe Adul… N55A1          
 9 PAL0708                28 Adelie Penguin… Anvers Biscoe Adul… N17A2          
10 PAL0910               113 Adelie Penguin… Anvers Biscoe Adul… N60A1          
# ℹ 158 more rows
# ℹ 10 more variables: `Clutch Completion` <chr>, `Date Egg` <date>,
#   `Culmen Length (mm)` <dbl>, `Culmen Depth (mm)` <dbl>,
#   `Flipper Length (mm)` <dbl>, `Body Mass (g)` <dbl>, Sex <chr>,
#   `Delta 15 N (o/oo)` <dbl>, `Delta 13 C (o/oo)` <dbl>, Comments <chr>
Exercise

Arrange the data by length_mass_ratio, the ratio of the penguin’s flipper length (in mm) and the penguin’s body mass (in g). (You should have code on how to create this variable from the last exercise). Save this as an object called `penguins_ratio_data

penguins_raw |> 
 select(Species, `Body Mass (g)`, matches("Length")) |> # select just for clarity
    rename(flipper_length = `Flipper Length (mm)`) |>
  mutate(length_mass_ratio = flipper_length/`Body Mass (g)`) |>
  arrange(length_mass_ratio)
# A tibble: 344 × 5
   Species `Body Mass (g)` `Culmen Length (mm)` flipper_length length_mass_ratio
   <chr>             <dbl>                <dbl>          <dbl>             <dbl>
 1 Gentoo…            6300                 49.2            221            0.0351
 2 Gentoo…            5850                 48.4            213            0.0364
 3 Gentoo…            6000                 51.1            220            0.0367
 4 Gentoo…            6000                 48.8            222            0.037 
 5 Gentoo…            5850                 49.3            217            0.0371
 6 Gentoo…            5950                 45.2            223            0.0375
 7 Gentoo…            5500                 48.1            209            0.038 
 8 Gentoo…            6050                 59.6            230            0.0380
 9 Gentoo…            5650                 47.8            215            0.0381
10 Gentoo…            5700                 50              218            0.0382
# ℹ 334 more rows
## Now save it as an object 
penguins_ratio_data <- penguins_raw |> 
 select(Species, `Body Mass (g)`, matches("Length")) |> # select just for clarity
    rename(flipper_length = `Flipper Length (mm)`) |>
  mutate(length_mass_ratio = flipper_length/`Body Mass (g)`) |>
  arrange(length_mass_ratio)

Summarizing data

Calculating summary statistics

dplyr makes summarizing data a breeze using the summarize() function:

penguins_raw |> 
  summarize(mean_flipper_length = mean(`Flipper Length (mm)`),
            mean_body_mass = mean(`Body Mass (g)`))
# A tibble: 1 × 2
  mean_flipper_length mean_body_mass
                <dbl>          <dbl>
1                  NA             NA
Tip

Oh no! If you want to calculate the mean or do another arithmatic operation on a numeric vector and R returns NA values, it likely means that the vector has missing values. Use na.rm = T to drop the NA values in your calculation. We’ll see more of this later in this lesson.

penguins_raw |> 
  summarize(mean_flipper_length = mean(`Flipper Length (mm)`, na.rm = T),
            mean_body_mass = mean(`Body Mass (g)`, na.rm = T))
# A tibble: 1 × 2
  mean_flipper_length mean_body_mass
                <dbl>          <dbl>
1                201.          4202.

To make summaries, we can use any function that takes a vector and returns one value. Another example:

penguins_raw |> 
  filter(`Clutch Completion` == "Yes") |> # to filter out penguins that did not have an (observed) full nest 
  summarize(max_flipper_length = max(`Flipper Length (mm)`, na.rm = T),
            min_flipper_length = min(`Flipper Length (mm)`, na.rm = T))
# A tibble: 1 × 2
  max_flipper_length min_flipper_length
               <dbl>              <dbl>
1                231                174

Grouped summaries allow us to disaggregate summaries according to other variables (usually categorical):

penguins_raw |> 
  filter(`Clutch Completion` == "Yes") |> # to filter out penguins that did not have an (observed) full nest 
  summarize(max_flipper_length = max(`Flipper Length (mm)`, na.rm = T),
            min_flipper_length = min(`Flipper Length (mm)`, na.rm = T),
            .by = Sex)  #  to group by sex 
# A tibble: 3 × 3
  Sex    max_flipper_length min_flipper_length
  <chr>               <dbl>              <dbl>
1 MALE                  231                178
2 FEMALE                222                174
3 <NA>                  217                179
penguins_raw |> 
  filter(`Clutch Completion` == "Yes") |> # to filter out penguins that did not have an (observed) full nest 
  summarize(max_flipper_length = max(`Flipper Length (mm)`, na.rm = T),
            min_flipper_length = min(`Flipper Length (mm)`, na.rm = T),
            .by = Sex) |>  #  to group by sex 
  filter(is.na(Sex) == F) # to drop the penguins with an unknown sex 
# A tibble: 2 × 3
  Sex    max_flipper_length min_flipper_length
  <chr>               <dbl>              <dbl>
1 MALE                  231                178
2 FEMALE                222                174
Exercise

Obtain the maximum and minimum flipper length to mass ratio (call them max_ratio and min_ratio, drawing from the length_mass_ratio variable from before) for each penguin species.

penguins_raw |> 
 select(Species, `Body Mass (g)`, matches("Length")) |> # select just for clarity
    rename(flipper_length = `Flipper Length (mm)`) |>
  mutate(length_mass_ratio = flipper_length/`Body Mass (g)`) |>
  # summarize flipper length to mass ratio by species
 summarize(max_ratio = max(length_mass_ratio, na.rm = T),
            min_ratio = min(length_mass_ratio, na.rm = T),
            .by = Species)   #  to group by species 
# A tibble: 3 × 3
  Species                                   max_ratio min_ratio
  <chr>                                         <dbl>     <dbl>
1 Adelie Penguin (Pygoscelis adeliae)          0.0660    0.0396
2 Gentoo penguin (Pygoscelis papua)            0.0527    0.0351
3 Chinstrap penguin (Pygoscelis antarctica)    0.0711    0.0438

Recoding variables

Take a look at the Species variable. We can do a simple tabulation with count():

penguins_raw |> 
  count(Species)
# A tibble: 3 × 2
  Species                                       n
  <chr>                                     <int>
1 Adelie Penguin (Pygoscelis adeliae)         152
2 Chinstrap penguin (Pygoscelis antarctica)    68
3 Gentoo penguin (Pygoscelis papua)           124
Tip

Another common way to compute quick tabulations in R is with the table() function. Be aware that this takes a vector as the input:

table(penguins_raw$Species)

      Adelie Penguin (Pygoscelis adeliae) 
                                      152 
Chinstrap penguin (Pygoscelis antarctica) 
                                       68 
        Gentoo penguin (Pygoscelis papua) 
                                      124 

We might want to recode this variable. For instance, if we are only interested in the Chinstrap penguins, we could create a dummy/binary variable for whether the penguin is a Chinstrap or not. We can do this with if_else(), which works with logical conditions:

penguins_raw |> 
  # the arguments are condition, true (what to do if true), false
  mutate(chinstrap = if_else(Species == "Chinstrap penguin (Pygoscelis antarctica)", 1, 0)) |> 
  count(chinstrap)
# A tibble: 2 × 2
  chinstrap     n
      <dbl> <int>
1         0   276
2         1    68

Instead of a numeric classification (0 and 1), we could use characters:

penguins_raw |> 
  # the arguments are condition, true (what to do if true), false
  mutate(chinstrap = if_else(Species == "Chinstrap penguin (Pygoscelis antarctica)", "Chinstrap", "Other")) |> 
  count(chinstrap)
# A tibble: 2 × 2
  chinstrap     n
  <chr>     <int>
1 Chinstrap    68
2 Other       276

if_else() is great for binary recoding. But sometimes we want to create more than two categories. We can use case_when(). This time, say we just want to simplify the Species variable to the familiar names of the penguins, not their scientific names:

penguins_raw |> 
  # syntax is condition ~ value
  mutate(species = case_when(
    Species == "Adelie Penguin (Pygoscelis adeliae)" ~ "Adelie",
    Species == "Chinstrap penguin (Pygoscelis antarctica)" ~ "Chinstrap", 
    Species == "Gentoo penguin (Pygoscelis papua)" ~ "Gentoo",
    .default = "Other" # what to do in all other cases
  )) |> 
  count(species)
# A tibble: 3 × 2
  species       n
  <chr>     <int>
1 Adelie      152
2 Chinstrap    68
3 Gentoo      124

Save this as an object called species_table. We will use this later.

species_table <- penguins_raw |> 
  # syntax is condition ~ value
  mutate(species = case_when(
    Species == "Adelie Penguin (Pygoscelis adeliae)" ~ "Adelie",
    Species == "Chinstrap penguin (Pygoscelis antarctica)" ~ "Chinstrap", 
    Species == "Gentoo penguin (Pygoscelis papua)" ~ "Gentoo",
    .default = "Other" # what to do in all other cases
  )) |> 
  count(species)

The .default = argument in case_when() can also be used to leave the variable as-is for non-specified cases. For example, let’s combine Adelie and Gentoo species:

penguins_raw |> 
  # syntax is condition ~ value
  mutate(species = case_when(
    Species %in% c("Adelie Penguin (Pygoscelis adeliae)", "Gentoo penguin (Pygoscelis papua)") ~ "Adelie/Gentoo",
    Species == "Chinstrap penguin (Pygoscelis antarctica)" ~ "Chinstrap",  
    .default = "Other" # what to do in all other cases
  )) |> 
  count(species)
# A tibble: 2 × 2
  species           n
  <chr>         <int>
1 Adelie/Gentoo   276
2 Chinstrap        68
Exercise
  1. Create a dummy variable, large_flipper, for whether the penguin has a flipper that is longer than 210mm. Then compute its mean.
penguins_raw |> 
  # the arguments are condition, true (what to do if true), false
  mutate(large_flipper = if_else(`Flipper Length (mm)` > 210, 1, 0)) |> 
  drop_na(large_flipper) |>
  summarise(large_flipper_mean = mean(large_flipper))
# A tibble: 1 × 1
  large_flipper_mean
               <dbl>
1              0.292
  1. Say you want to get more specific and determine whether the flipper is small, medium, or large. Say a small flipper is 180mm or smaller, a medium-sized flipper ranges from 180 - 210mm, and a large flipper is longer than 210mm. Create the variable flipper_size that takes on the values Small, Medium, or Large depending on the length.
penguins_raw |> 
  # the arguments are condition, true (what to do if true), false
  mutate(flipper_size = case_when(`Flipper Length (mm)` <= 180 ~ "Small",
                                   `Flipper Length (mm)` > 180 & `Flipper Length (mm)` < 210 ~ "Medium", 
                                   `Flipper Length (mm)` >= 210 ~ "Large",
                                   .default = "Other")) |> 
           drop_na(flipper_size) |>
           count(flipper_size)
# A tibble: 4 × 2
  flipper_size     n
  <chr>        <int>
1 Large          114
2 Medium         215
3 Other            2
4 Small           13

Missing values

Missing values are commonplace in real datasets. In R, missing values are a special type of value in vectors, denoted as NA.

Warning

The special value NA is different from the character value “NA”. For example, notice that a numeric vector can have NAs, while it obviously cannot hold the character value “NA”:

c(5, 4.6, NA, 8)
[1] 5.0 4.6  NA 8.0

A quick way to check for missing values in small datasets is with the summary() function:

summary(penguins_raw)
  studyName         Sample Number      Species             Region         
 Length:344         Min.   :  1.00   Length:344         Length:344        
 Class :character   1st Qu.: 29.00   Class :character   Class :character  
 Mode  :character   Median : 58.00   Mode  :character   Mode  :character  
                    Mean   : 63.15                                        
                    3rd Qu.: 95.25                                        
                    Max.   :152.00                                        
                                                                          
    Island             Stage           Individual ID      Clutch Completion 
 Length:344         Length:344         Length:344         Length:344        
 Class :character   Class :character   Class :character   Class :character  
 Mode  :character   Mode  :character   Mode  :character   Mode  :character  


    Date Egg          Culmen Length (mm) Culmen Depth (mm) Flipper Length (mm)
 Min.   :2007-11-09   Min.   :32.10      Min.   :13.10     Min.   :172.0      
 1st Qu.:2007-11-28   1st Qu.:39.23      1st Qu.:15.60     1st Qu.:190.0      
 Median :2008-11-09   Median :44.45      Median :17.30     Median :197.0      
 Mean   :2008-11-27   Mean   :43.92      Mean   :17.15     Mean   :200.9      
 3rd Qu.:2009-11-16   3rd Qu.:48.50      3rd Qu.:18.70     3rd Qu.:213.0      
 Max.   :2009-12-01   Max.   :59.60      Max.   :21.50     Max.   :231.0      
                      NA's   :2          NA's   :2         NA's   :2          
 Body Mass (g)      Sex            Delta 15 N (o/oo) Delta 13 C (o/oo)
 Min.   :2700   Length:344         Min.   : 7.632    Min.   :-27.02   
 1st Qu.:3550   Class :character   1st Qu.: 8.300    1st Qu.:-26.32   
 Median :4050   Mode  :character   Median : 8.652    Median :-25.83   
 Mean   :4202                      Mean   : 8.733    Mean   :-25.69   
 3rd Qu.:4750                      3rd Qu.: 9.172    3rd Qu.:-25.06   
 Max.   :6300                      Max.   :10.025    Max.   :-23.79   
 NA's   :2                         NA's   :14        NA's   :13       
   Comments        
 Length:344        
 Class :character  
 Mode  :character  


Notice that we have missingness in the Flipper Length (mm) and Body Mass (g) variables, among others. We might want to filter the dataset to see which observations are in this situation:

penguins_raw |> 
  filter(`Body Mass (g)` == NA | `Flipper Length (mm)` == NA)
# A tibble: 0 × 17
# ℹ 17 variables: studyName <chr>, Sample Number <dbl>, Species <chr>,
#   Region <chr>, Island <chr>, Stage <chr>, Individual ID <chr>,
#   Clutch Completion <chr>, Date Egg <date>, Culmen Length (mm) <dbl>,
#   Culmen Depth (mm) <dbl>, Flipper Length (mm) <dbl>, Body Mass (g) <dbl>,
#   Sex <chr>, Delta 15 N (o/oo) <dbl>, Delta 13 C (o/oo) <dbl>, Comments <chr>

But the code above doesn’t work! To refer to missing values in logical conditions, we cannot use == NA. Instead, we need to use the is.na() function:

penguins_raw |> 
  filter(is.na(`Body Mass (g)`) | is.na(`Flipper Length (mm)`))
# A tibble: 2 × 17
  studyName `Sample Number` Species          Region Island Stage `Individual ID`
  <chr>               <dbl> <chr>            <chr>  <chr>  <chr> <chr>          
1 PAL0708                 4 Adelie Penguin … Anvers Torge… Adul… N2A2           
2 PAL0910               120 Gentoo penguin … Anvers Biscoe Adul… N38A2          
# ℹ 10 more variables: `Clutch Completion` <chr>, `Date Egg` <date>,
#   `Culmen Length (mm)` <dbl>, `Culmen Depth (mm)` <dbl>,
#   `Flipper Length (mm)` <dbl>, `Body Mass (g)` <dbl>, Sex <chr>,
#   `Delta 15 N (o/oo)` <dbl>, `Delta 13 C (o/oo)` <dbl>, Comments <chr>

As we saw earlier when trying to calculate the mean, in most R functions, missing values are “contagious.” This means that any missing value will contaminate the operation and carry over to the results. Recall:

penguins_raw |> 
  summarize(mean_flipper_length = mean(`Flipper Length (mm)`))
# A tibble: 1 × 1
  mean_flipper_length
                <dbl>
1                  NA

Sometimes we’d like to perform our operations even in the presence of missing values, simply excluding them. Most basic R functions have an na.rm = argument to do this:

penguins_raw |> 
  summarize(mean_flipper_length = mean(`Flipper Length (mm)`, na.rm = T))
# A tibble: 1 × 1
  mean_flipper_length
                <dbl>
1                201.
Exercise

Calculate the median value of the penguins’ flipper length and body mass for each Island (i.e., perform a grouped summary).

penguins_raw |> 
    summarize(median_flipper_length = median(`Flipper Length (mm)`, na.rm = T),
              median_body_mass = median(`Body Mass (g)`, na.rm = T),
              .by = Island)
# A tibble: 3 × 3
  Island    median_flipper_length median_body_mass
  <chr>                     <dbl>            <dbl>
1 Torgersen                   191            3700 
2 Biscoe                      214            4775 
3 Dream                       193            3688.

Overview

Function Purpose
select() Select columns
rename() Rename columns
mutate() Creating columns
filter() Filtering rows
arrange() Ordering rows
summarize() Summarizing data
summarize(…, .by = ) Summarizing data (by groups)
if_else() Recode to a binary variable
case_when() Recode to a categorical variable
is.na(), na.rm(). Identify and remove missing data

Saving and exporting cleaned data

As in the plotting lesson, you will often want to save or export your cleaned data. This is especially true if you are working on complex data cleaning tasks, and you will use your cleaned dataset for other scripts in the same project. You can save cleaned data in a variety of file formats: you can save them as data files (as .csv files, or as native R data files, with .rds or .rda file extensions) or export the tables for reports (for integration, as Microsoft Word documents, html tables, or as images).

We will practice one of each.

## To export to a .csv 
save(penguins_ratio_data, file = "penguins_ratio_data.csv")

## To save as .rda file
save(penguins_ratio_data, species_table, file = "penguins_cleaned.rda")

## To make a table for export
knitr::kable(species_table, format = "markdown", caption = "N Penguins by Species") %>%
  save_kable("species_table.pdf")

Your table will look like this:

## To make a table for export
knitr::kable(species_table, format = "markdown", 
             caption = "N Penguins by Species")
N Penguins by Species
species n
Adelie 152
Chinstrap 68
Gentoo 124

Now we’ll once again use the git tools within RStudio to commit these files and push them to our GitHub repository. Click on the “Git” tab in the top-right. Clicking this tab will show you all of the files that have been modified since we last committed. In this case, you should see your code file, your cleaned data for future use, and your table to export for a report. Click the boxes next to these three files to queue them for committing. Then click the Commit button. Write a succinct commit message in the window, then click the Commit button, then the Push button. And that’s that!

Back to top